PROC REPORT基礎
1 PROC REPORT語法
PROC REPORT data= SAS-data-set options ;
COLUMNS variable_1 …. variable_n;
DEFINE variable_1;
DEFINE variable_2;
. . .
DEFINE variable_n;
COMPUTE blocks
BREAK … ;
RBREAK … ;
RUN;
COLUMNS:指定輸出到報表的列
DEFINE:上述列的格式等
COMPUTE:計算模塊
BREAK / RBREAK:生成合計�,或報表其它類型的格式����。
PROC REPORT的選項Options有很多����,下面介紹幾個常用的:
DATA= 指定做報表的數據集
PROMPT= PROMPT模式
NOWINDOWS= 不輸出到結果
REPORT = 指定一個存儲的報表來生成新報表
OUTREPT= 指定新路徑來存放報表
OUT= 建立新數據集
HEADLINE 在報表變量標題和內容間生成一個水平分隔線
HEADSKIP 在報表變量標題和內容間生成一行空格
2 先生成一個基本的報表
先生成數據:
data mnthly_sales;
length zip $ 5 cty $ 8 var $ 10;
input zip $ cty $ var $ sales;
label zip="Zip Code"
cty="County"
var="Variety"
sales="Monthly Sales";
datalines;
52423 Scott Merlot 186.
52423 Scott Chardonnay 156.61
52423 Scott Zinfandel 35.5
52423 Scott Merlot 55.3
52388 Scott Merlot 122.89
52388 Scott Chardonnay 78.22
52388 Scott Zinfandel 15.4
52200 Adams Merlot 385.51
52200 Adams Chardonnay 246
52200 Adams Zinfandel 151.1
52200 Adams Chardonnay 76.24
52199 Adams Merlot 233.03
52199 Adams Chardonnay 185.22
52199 Adams Zinfandel 95.84
;
run;
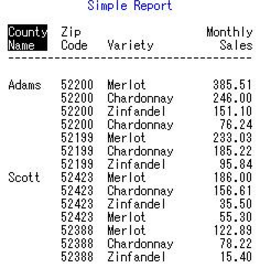
Proc Report生成最基本的報表:
proc report data=mnthly_sales
headline headskip ;
title1 "Simple Report";
column cty zip var sales;
define cty / display width=6 'County/Name';
define zip / display;
define var / display;
define sales / display format=6.2 width=10;
run;
這里的define后面的’/’��,其后面有很多選項來對變量格式�����,輸出方式等進行設置��,其選項如下:
GROUP:分組顯示
DISPLAY:一般顯示
ANALYSIS:其值用于計算或統計
ORDER:按其值排序顯示
ACROSS:交叉顯示
COMPUTED:其值在compute塊里計算得到
結果:

3 使用order���,按指定變量名排序顯示
proc report data=mnthly_sales
headline headskip ;
title1 "Simple Report";
column cty zip var sales;
define cty / order width=6 'County/Name';
define zip / display;
define var / display;
define sales / display format=6.2 width=10;
run;
結果:
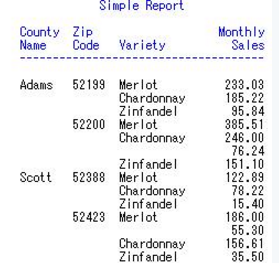
4 group分組顯示
proc report data=mnthly_sales nofs
headline headskip ;
title1 "Simple Report";
column cty zip var sales;
define cty / group width=6 'County/Name';
define zip / group;
define var / group order=freq descending;
define sales / display format=6.2 width=10;
run;
結果:
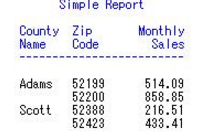
5 analysis��,統計量求和
proc report data=mnthly_sales nofs
headline headskip ;
title1 "Simple Report";
column cty zip sales;
define cty / group width=6 'County/Name';
define zip / group;
define sales / analysis sum format=6.2 width=10;
run;
結果:
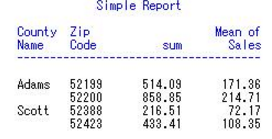
6 求多個統計量
proc report data=mnthly_sales nofs
headline headskip ;
title1 "Simple Report";
column cty zip sales sales=mean_sales;
define cty / group width=6 'County/Name';
define zip / group;
define sales / analysis sum format=6.2 width=10 'sum';
define mean_sales / analysis mean format=6.2 width=10 'Mean of/Sales';
run;
結果:
7 如果你想讓某變量的每一個值都作為一列��,那就要用到across�。這里要注意的是��,有across選項的var��,在column時后面加了一個’,’�����,從而將其后面的變量的數據直接放到across變量下�����。��。
proc report data=mnthly_sales nofs headline headskip;
title1 "Cross Tab Report (Across Type)";
column cty zip var,sales;
define cty / group width=6 'County/Name';
define zip / group;
define var / across order=freq descending '- Grape Variety -';
define sales / analysis sum format=6.2 width=10 'Revenue';
run;
結果:
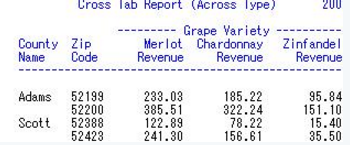
這里�,變量variety的每一個值都成為了新的列
8 BREAK與RBREAK��,對分組后的報表匯總
proc report data=mnthly_sales nofs headline headskip;
title1 "Report with Breaks";
column cty zip var,sales;
define cty / group width=6 'County/Name';
define zip / group;
define var / across order=freq descending '- Grape Variety -';
define sales / analysis sum format=6.2 width=10 'Revenue';
break after cty / ol skip summarize suppress;
rbreak after / dol skip summarize;
run;
結果:
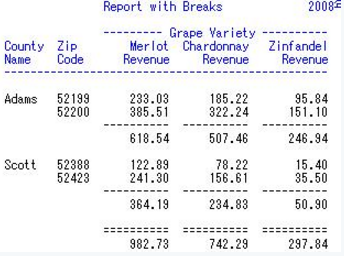
這里說明一下BREAK與RBREAK后面的選項:
OL 匯總上方加一條線
DOL匯總上方加兩條線
UL匯總下方加一條線
DUL 匯總下方加兩條線
summarize 對每組進行匯總
skip 加入一空白行
suppress 在匯總行不顯示組名
9 compute塊����,計算統計變量�,這個以后將專門介紹
proc report data=mnthly_sales nofs headline headskip;
title1 "Report with Row Sums (Computed Type)";
column cty zip var,sales row_sum;
define cty / group width=6 'County/Name';
define zip / group;
define var / across order=freq descending '- Grape Variety -';
define sales / analysis sum format=6.2 width=10 'Revenue';
define row_sum / computed format=comma10.2 'Total';
break after cty / ol skip summarize suppress;
rbreak after / dol skip summarize;
compute row_sum;
row_sum = sum(_C3_,_C4_,_C5_,_C6_,_C7_,_C8_);
endcompute;
run;
結果:
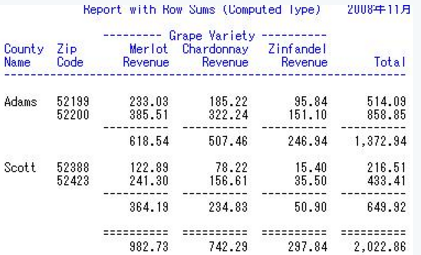
Compute塊是以compute開始����,endcompute為結尾���,可以計算出很多復雜的數據�。這里的_C*_表示第幾列的變量����,例如_C3_表示第三列�,_C#_代表最后一行�。這里的_C7_和_C8_是多余的����,但不影響結果��。
10 proc report與ODS�����,以后會詳細介紹�。這里用ODS輸出report過程結果����,方法很簡單�,就是將上面的report代碼放入ods語句之間�����。
ods listing close;
ods rtf file = ‘c:sugi30.rtf’;
上面的proc report過程代碼放在這里就行
ods rtf close;
即:
ods listing close;
ods rtf file = 'c:sugi30.rtf';
proc report data=mnthly_sales nofs headline headskip;
title1 "Report with Row Sums (Computed Type)";
column cty zip var,sales row_sum;
define cty / group width=6 'County/Name';
define zip / group;
define var / across order=freq descending '- Grape Variety -';
define sales / analysis sum format=6.2 width=10 'Revenue';
define row_sum / computed format=comma10.2 'Total';
break after cty / ol skip summarize suppress;
rbreak after / dol skip summarize;
compute row_sum;
row_sum = sum(_C3_,_C4_,_C5_,_C6_,_C7_,_C8_);
endcompute;
run;
ods rtf close;
結果:
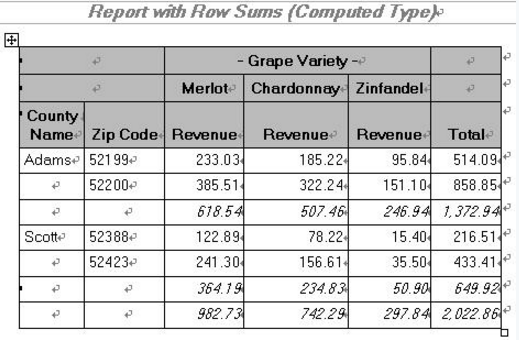
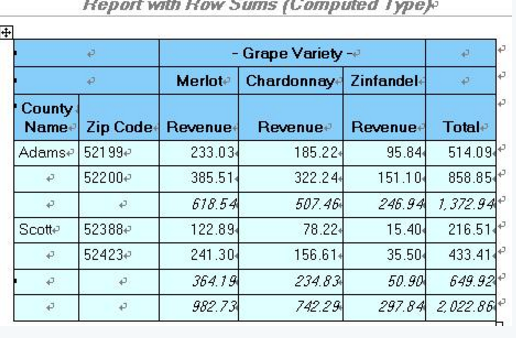
11 report設置style�,讓報表更炫一點��。這個以后也會詳細介紹
ods listing close;
ods rtf file = 'c:sugi30.rtf';
proc report data=mnthly_sales nofs headline headskip
style(header)={background=lightskyblue foreground=black}
style(column)={background=lightcyan foreground=black};
title1 "Report with Row Sums (Computed Type)";
column cty zip var,sales row_sum;
define cty / group width=6 'County/Name';
define zip / group;
define var / across order=freq descending '- Grape Variety -';
define sales / analysis sum format=6.2 width=10 'Revenue';
define row_sum / computed format=comma10.2 'Total';
break after cty / ol skip summarize suppress;
rbreak after / dol skip summarize;
compute row_sum;
row_sum = sum(_C3_,_C4_,_C5_,_C6_,_C7_,_C8_);
endcompute;
run;
ods rtf close;
結果:
CDA數據分析師考試相關入口一覽(建議收藏):
? 想報名CDA認證考試�,點擊>>>
“CDA報名”
了解CDA考試詳情��;
? 想學習CDA考試教材�����,點擊>>> “CDA教材” 了解CDA考試詳情��;
? 想加入CDA考試題庫���,點擊>>> “CDA題庫” 了解CDA考試詳情���;
? 想了解CDA考試含金量����,點擊>>> “CDA含金量” 了解CDA考試詳情�����;


 京公網安備 11010802034615號
經營許可證編號:京B2-20210330
京公網安備 11010802034615號
經營許可證編號:京B2-20210330
