機器學習優化算法之爬山算法小結
機器學習的項目,不可避免的需要補充一些優化算法,對于優化算法,爬山算法還是比較重要的.鑒于此,花了些時間仔細閱讀了些爬山算法的paper.基于這些,做一些總結.
目錄
1. 爬山算法簡單描述
2. 爬山算法的主要算法
2.1 首選爬山算法
2.2 最陡爬山算法
2.3 隨機重新開始爬山算法
2.4 模擬退火算法(也是爬山算法)
3. 實例求解
正文
爬山算法,是一種局部貪心的最優算法. 該算法的主要思想是:每次拿相鄰點與當前點進行比對,取兩者中較優者,作為爬坡的下一步.
舉一個例子,求解下面表達式 的最大值. 且假設 x,y均按為0.1間隔遞增.
為了更好的描述,我們先使用pyhton畫出該函數的圖像:
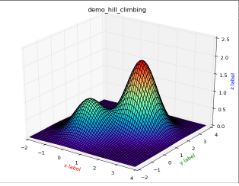
圖像的python代碼:
1 # encoding:utf8
2 from matplotlib import pyplot as plt
3 import numpy as np
4 from mpl_toolkits.mplot3d import Axes3D
5
6
7 def func(X, Y, x_move=0, y_move=0):
8 def mul(X, Y, alis=1):
9 return alis * np.exp(-(X * X + Y * Y))
10
11 return mul(X, Y) + mul(X - x_move, Y - y_move, 2)
12
13
14 def show(X, Y):
15 fig = plt.figure()
16 ax = Axes3D(fig)
17 X, Y = np.meshgrid(X, Y)
18 Z = func(X, Y, 1.7, 1.7)
19 plt.title("demo_hill_climbing")
20 ax.plot_surface(X, Y, Z, rstride=1, cstride=1, cmap='rainbow', )
21 ax.set_xlabel('x label', color='r')
22 ax.set_ylabel('y label', color='g')
23 ax.set_zlabel('z label', color='b')
24 # 具體函數方法可用 help(function) 查看���,如:help(ax.plot_surface)
25 # ax.scatter(X,Y,Z,c='r') #繪點
26 plt.show()
27
28 if __name__ == '__main__':
29 X = np.arange(-2, 4, 0.1)
30 Y = np.arange(-2, 4, 0.1)
31
32 show(X,Y)
View Code
對于上面這個問題,我們使用爬山算法該如何求解呢? 下面我們從爬山算法中的幾種方式分別求解一下這個小題.
1. 首選爬山算法
依次尋找該點X的鄰近點中首次出現的比點X價值高的點,并將該點作為爬山的點(此處說的價值高,在該題中是指Z或f(x,y)值較大). 依次循環,直至該點的鄰近點中不再有比其大的點. 我們成為該點就是山的頂點,又稱為最優點.
那么解題思路就有:
1. 隨機選擇一個登山的起點S(x0,y0,z0),并以此為起點開始登山.直至"登頂".
下面是我們實現的代碼:
1 # encoding:utf8
2 from random import random, randint
3
4 from matplotlib import pyplot as plt
5 import numpy as np
6 from mpl_toolkits.mplot3d import Axes3D
7
8
9 def func(X, Y, x_move=1.7, y_move=1.7):
10 def mul(X, Y, alis=1):
11 return alis * np.exp(-(X * X + Y * Y))
12
13 return mul(X, Y) + mul(X - x_move, Y - y_move, 2)
14
15
16 def show(X, Y, Z):
17 fig = plt.figure()
18 ax = Axes3D(fig)
19 plt.title("demo_hill_climbing")
20 ax.plot_surface(X, Y, Z, rstride=1, cstride=1, cmap='rainbow', )
21 ax.set_xlabel('x label', color='r')
22 ax.set_ylabel('y label', color='g')
23 ax.set_zlabel('z label', color='b')
24 # ax.scatter(X,Y,Z,c='r') #繪點
25 plt.show()
26
27
28 def drawPaht(X, Y, Z,px,py,pz):
29 fig = plt.figure()
30 ax = Axes3D(fig)
31 plt.title("demo_hill_climbing")
32 ax.plot_surface(X, Y, Z, rstride=1, cstride=1, cmap='rainbow', )
33 ax.set_xlabel('x label', color='r')
34 ax.set_ylabel('y label', color='g')
35 ax.set_zlabel('z label', color='b')
36 ax.plot(px,py,pz,'r.') #繪點
37 plt.show()
38
39
40 def hill_climb(X, Y):
41 global_X = []
42 global_Y = []
43
44 len_x = len(X)
45 len_y = len(Y)
46 # 隨機登山點
47 st_x = randint(0, len_x-1)
48 st_y = randint(0, len_y-1)
49
50 def argmax(stx, sty, alisx=0, alisy=0):
51 cur = func(X[0][st_x], Y[st_y][0])
52 next = func(X[0][st_x + alisx], Y[st_y + alisy][0])
53
54 return cur < next and True or False
55
56 while (len_x > st_x >= 0) or (len_y > st_y >= 0):
57 if st_x + 1 < len_x and argmax(st_x, st_y, 1):
58 st_x += 1
59 elif st_y + 1 < len_x and argmax(st_x, st_y, 0, 1):
60 st_y += 1
61 elif st_x >= 1 and argmax(st_x, st_y, -1):
62 st_x -= 1
63 elif st_y >= 1 and argmax(st_x, st_y, 0, -1):
64 st_y -= 1
65 else:
66 break
67 global_X.append(X[0][st_x])
68 global_Y.append(Y[st_y][0])
69 return global_X, global_Y, func(X[0][st_x], Y[st_y][0])
70
71
72 if __name__ == '__main__':
73 X = np.arange(-2, 4, 0.1)
74 Y = np.arange(-2, 4, 0.1)
75 X, Y = np.meshgrid(X, Y)
76 Z = func(X, Y, 1.7, 1.7)
77 px, py, maxhill = hill_climb(X, Y)
78 print px,py,maxhill
79 drawPaht(X, Y, Z,px,py,func(np.array(px), np.array(py), 1.7, 1.7))
View Code
對比幾次運行的結果:
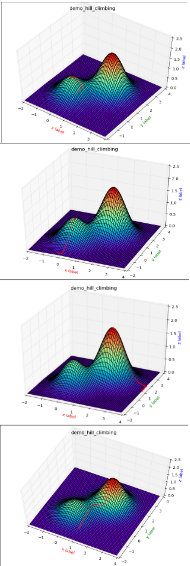
從上圖中,我們可以比較清楚的觀察到,首選爬山算法的缺陷.
2.那么最陡爬山算法呢?
簡單描述:
最陡爬山算法是在首選爬山算法上的一種改良,它規定每次選取鄰近點價值最大的那個點作為爬上的點.
下面我們來實現一下它:
1 # encoding:utf8
2 from random import random, randint
3
4 from matplotlib import pyplot as plt
5 import numpy as np
6 from mpl_toolkits.mplot3d import Axes3D
7
8
9 def func(X, Y, x_move=1.7, y_move=1.7):
10 def mul(X, Y, alis=1):
11 return alis * np.exp(-(X * X + Y * Y))
12
13 return mul(X, Y) + mul(X - x_move, Y - y_move, 2)
14
15
16 def show(X, Y, Z):
17 fig = plt.figure()
18 ax = Axes3D(fig)
19 plt.title("demo_hill_climbing")
20 ax.plot_surface(X, Y, Z, rstride=1, cstride=1, cmap='rainbow', )
21 ax.set_xlabel('x label', color='r')
22 ax.set_ylabel('y label', color='g')
23 ax.set_zlabel('z label', color='b')
24 # ax.scatter(X,Y,Z,c='r') #繪點
25 plt.show()
26
27
28 def drawPaht(X, Y, Z, px, py, pz):
29 fig = plt.figure()
30 ax = Axes3D(fig)
31 plt.title("demo_hill_climbing")
32 ax.plot_surface(X, Y, Z, rstride=1, cstride=1, cmap='rainbow', )
33 ax.set_xlabel('x label', color='r')
34 ax.set_ylabel('y label', color='g')
35 ax.set_zlabel('z label', color='b')
36 ax.plot(px, py, pz, 'r.') # 繪點
37 plt.show()
38
39
40 def hill_climb(X, Y):
41 global_X = []
42 global_Y = []
43
44 len_x = len(X)
45 len_y = len(Y)
46 # 隨機登山點
47 st_x = randint(0, len_x - 1)
48 st_y = randint(0, len_y - 1)
49
50 def argmax(stx, sty, alisx, alisy):
51 cur = func(X[0][stx], Y[sty][0])
52 next = func(X[0][alisx], Y[alisy][0])
53 if cur < next:
54 return alisx, alisy
55 return stx, sty
56 #return cur < next and alisx, alisy or stx, sty
57
58 tmp_x = st_x
59 tmp_y = st_y
60 while (len_x > st_x >= 0) or (len_y > st_y >= 0):
61 if st_x + 1 < len_x:
62 tmp_x, tmp_y = argmax(tmp_x, tmp_y, (st_x + 1), st_y)
63
64 if st_x >= 1:
65 tmp_x, tmp_y = argmax(tmp_x, tmp_y, st_x - 1, st_y)
66
67 if st_y + 1 < len_x:
68 tmp_x, tmp_y = argmax(tmp_x, tmp_y, st_x, st_y + 1)
69
70 if st_y >= 1:
71 tmp_x, tmp_y = argmax(tmp_x, tmp_y, st_x, st_y - 1)
72
73 if tmp_x != st_x or tmp_y != st_y:
74 st_x = tmp_x
75 st_y = tmp_y
76 else:
77 break
78 global_X.append(X[0][st_x])
79 global_Y.append(Y[st_y][0])
80 return global_X, global_Y, func(X[0][st_x], Y[st_y][0])
81
82
83 if __name__ == '__main__':
84 X = np.arange(-2, 4, 0.1)
85 Y = np.arange(-2, 4, 0.1)
86 X, Y = np.meshgrid(X, Y)
87 Z = func(X, Y, 1.7, 1.7)
88 px, py, maxhill = hill_climb(X, Y)
89 print px, py, maxhill
90 drawPaht(X, Y, Z, px, py, func(np.array(px), np.array(py), 1.7, 1.7))
View Code
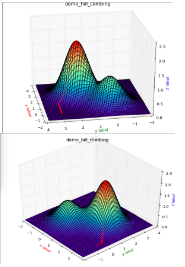
從這個結果來看,因為范圍擴大了一點,所以效果會好一點點,當依舊是一個局部最優算法.
3.隨機重新開始爬山算法呢?
簡單的描述:
隨機重新開始爬山算法是基于最陡爬山算法,其實就是加一個達到全局最優解的條件,如果滿足該條件,就結束運算,反之則無限次重復運算最陡爬山算法.
由于此題,并沒有結束的特征條件,我們這里就不給予實現.
4.模擬退火算法
簡單描述:
(1)隨機挑選一個單元k��,并給它一個隨機的位移��,求出系統因此而產生的能量變化ΔEk�����。
(2)若ΔEk?0�,該位移可采納�����,而變化后的系統狀態可作為下次變化的起點�;
若ΔEk>0�,位移后的狀態可采納的概率為 
式中T為溫度�,然后從(0,1)區間均勻分布的隨機數中挑選一個數R�,若R<Pk�,則將變化后的狀態作為下次的起點���;否則���,將變化前的狀態作為下次的起點����。 數據分析培訓
(3)轉第(1)步繼續執行�,知道達到平衡狀態為止����。
代碼實現為:
1 # encoding:utf8
2 from random import random, randint
3
4 from matplotlib import pyplot as plt
5 import numpy as np
6 from mpl_toolkits.mplot3d import Axes3D
7
8
9 def func(X, Y, x_move=1.7, y_move=1.7):
10 def mul(X, Y, alis=1):
11 return alis * np.exp(-(X * X + Y * Y))
12
13 return mul(X, Y) + mul(X - x_move, Y - y_move, 2)
14
15
16 def show(X, Y, Z):
17 fig = plt.figure()
18 ax = Axes3D(fig)
19 plt.title("demo_hill_climbing")
20 ax.plot_surface(X, Y, Z, rstride=1, cstride=1, cmap='rainbow', )
21 ax.set_xlabel('x label', color='r')
22 ax.set_ylabel('y label', color='g')
23 ax.set_zlabel('z label', color='b')
24 # ax.scatter(X,Y,Z,c='r') #繪點
25 plt.show()
26
27
28 def drawPaht(X, Y, Z, px, py, pz):
29 fig = plt.figure()
30 ax = Axes3D(fig)
31 plt.title("demo_hill_climbing")
32 ax.plot_surface(X, Y, Z, rstride=1, cstride=1, color='b' )
33 ax.set_xlabel('x label', color='r')
34 ax.set_ylabel('y label', color='g')
35 ax.set_zlabel('z label', color='b')
36 ax.plot(px, py, pz, 'r.') # 繪點
37 plt.show()
38
39
40 def hill_climb(X, Y):
41 global_X = []
42 global_Y = []
43 # 初始溫度
44 temperature = 105.5
45 # 溫度下降的比率
46 delta = 0.98
47 # 溫度精確度
48 tmin = 1e-10
49
50 len_x = len(X)
51 len_y = len(Y)
52
53 # 隨機登山點
54 st_x = X[0][randint(0, len_x - 1)]
55 st_y = Y[randint(0, len_y - 1)][0]
56 st_z = func(st_x, st_y)
57
58 def argmax(stx, sty, alisx, alisy):
59 cur = func(st_x, st_y)
60 next = func(alisx, alisy)
61
62 return cur < next and True or False
63
64 while (temperature > tmin):
65 # 隨機產生一個新的鄰近點
66 # 說明: 溫度越高幅度鄰近點跳躍的幅度越大
67 tmp_x = st_x + (random() * 2 - 1) * temperature
68 tmp_y = st_y + + (random() * 2 - 1) * temperature
69 if 4 > tmp_x >= -2 and 4 > tmp_y >= -2:
70 if argmax(st_x, st_y, tmp_x, tmp_y):
71 st_x = tmp_x
72 st_y = tmp_y
73 else: # 有機會跳出局域最優解
74 pp = 1.0 / (1.0 + np.exp(-(func(tmp_x, tmp_y) - func(st_x, st_y)) / temperature))
75 if random() < pp:
76 st_x = tmp_x
77 st_y = tmp_y
78 temperature *= delta # 以一定的速率下降
79 global_X.append(st_x)
80 global_Y.append(st_y)
81 return global_X, global_Y, func(st_x, st_y)
82
83
84 if __name__ == '__main__':
85 X = np.arange(-2, 4, 0.1)
86 Y = np.arange(-2, 4, 0.1)
87 X, Y = np.meshgrid(X, Y)
88 Z = func(X, Y, 1.7, 1.7)
89 px, py, maxhill = hill_climb(X, Y)
90 print px, py, maxhill
91 drawPaht(X, Y, Z, px, py, func(np.array(px), np.array(py), 1.7, 1.7))
View Code
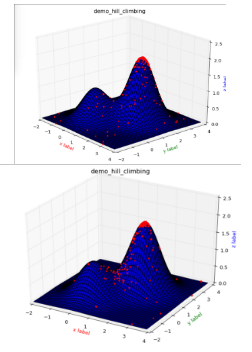
效果:
CDA數據分析師考試相關入口一覽(建議收藏):
? 想報名CDA認證考試�,點擊>>>
“CDA報名”
了解CDA考試詳情��;
? 想學習CDA考試教材���,點擊>>> “CDA教材” 了解CDA考試詳情�����;
? 想加入CDA考試題庫�����,點擊>>> “CDA題庫” 了解CDA考試詳情�;
? 想了解CDA考試含金量����,點擊>>> “CDA含金量” 了解CDA考試詳情�;


 京公網安備 11010802034615號
經營許可證編號:京B2-20210330
京公網安備 11010802034615號
經營許可證編號:京B2-20210330
