利用python求解物理學中的雙彈簧質能系統詳解
本文主要給大家介紹了關于利用python求解物理學中雙彈簧質能系統的相關內容�,分享出來供大家參考學習�����,下面話不多說了��,來一起看看詳細的介紹吧��。
物理的模型如下:
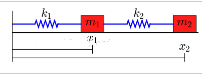
在這個系統里有兩個物體���,它們的質量分別是m1和m2�����,被兩個彈簧連接在一起���,伸縮系統為k1和k2�,左端固定����。假定沒有外力時��,兩個彈簧的長度為L1和L2����。
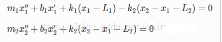
由于兩物體有重力��,那么在平面上形成摩擦力����,那么摩擦系數分別為b1和b2�����。所以可以把微分方程寫成這樣:
這是一個二階的微分方程�,為了使用python來求解��,需要把它轉換為一階微分方程�。所以引入下面兩個變量:
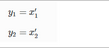
這兩個相當于運動的速度�。通過運算可以改為這樣:
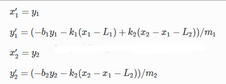
這時可以線性方程改為向量數組的方式�,就可以使用python定義了
代碼如下:
# Use ODEINT to solve the differential equations defined by the vector field
from scipy.integrate import odeint
def vectorfield(w, t, p):
"""
Defines the differential equations for the coupled spring-mass system.
Arguments:
w : vector of the state variables:
w = [x1,y1,x2,y2]
t : time
p : vector of the parameters:
p = [m1,m2,k1,k2,L1,L2,b1,b2]
"""
x1, y1, x2, y2 = w
m1, m2, k1, k2, L1, L2, b1, b2 = p
# Create f = (x1',y1',x2',y2'):
f = [y1,
(-b1 * y1 - k1 * (x1 - L1) + k2 * (x2 - x1 - L2)) / m1,
y2,
(-b2 * y2 - k2 * (x2 - x1 - L2)) / m2]
return f
# Parameter values
# Masses:
m1 = 1.0
m2 = 1.5
# Spring constants
k1 = 8.0
k2 = 40.0
# Natural lengths
L1 = 0.5
L2 = 1.0
# Friction coefficients
b1 = 0.8
b2 = 0.5
# Initial conditions
# x1 and x2 are the initial displacements; y1 and y2 are the initial velocities
x1 = 0.5
y1 = 0.0
x2 = 2.25
y2 = 0.0
# ODE solver parameters
abserr = 1.0e-8
relerr = 1.0e-6
stoptime = 10.0
numpoints = 250
# Create the time samples for the output of the ODE solver.
# I use a large number of points, only because I want to make
# a plot of the solution that looks nice.
t = [stoptime * float(i) / (numpoints - 1) for i in range(numpoints)]
# Pack up the parameters and initial conditions:
p = [m1, m2, k1, k2, L1, L2, b1, b2]
w0 = [x1, y1, x2, y2]
# Call the ODE solver.
wsol = odeint(vectorfield, w0, t, args=(p,),
atol=abserr, rtol=relerr)
with open('two_springs.dat', 'w') as f:
# Print & save the solution.
for t1, w1 in zip(t, wsol):
out = '{0} {1} {2} {3} {4}\n'.format(t1, w1[0], w1[1], w1[2], w1[3]);
print(out)
f.write(out);
在這里把結果輸出到文件two_springs.dat���,接著寫一個程序來把數據顯示成圖片�����,就可以發表論文了����,代碼如下:
# Plot the solution that was generated
from numpy import loadtxt
from pylab import figure, plot, xlabel, grid, hold, legend, title, savefig
from matplotlib.font_manager import FontProperties
t, x1, xy, x2, y2 = loadtxt('two_springs.dat', unpack=True)
figure(1, figsize=(6, 4.5))
xlabel('t')
grid(True)
lw = 1
plot(t, x1, 'b', linewidth=lw)
plot(t, x2, 'g', linewidth=lw)
legend((r'$x_1$', r'$x_2$'), prop=FontProperties(size=16))
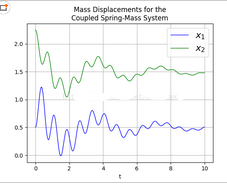
title('Mass Displacements for the\nCoupled Spring-Mass System')
savefig('two_springs.png', dpi=100)
最后來查看一下輸出的png圖片如下:
總結
以上就是這篇文章的全部內容了�����,希望本文的內容對大家的學習或者工作具有一定的參考學習價值
CDA數據分析師考試相關入口一覽(建議收藏):
? 想報名CDA認證考試�����,點擊>>>
“CDA報名”
了解CDA考試詳情��;
? 想學習CDA考試教材����,點擊>>> “CDA教材” 了解CDA考試詳情�����;
? 想加入CDA考試題庫�����,點擊>>> “CDA題庫” 了解CDA考試詳情��;
? 想了解CDA考試含金量��,點擊>>> “CDA含金量” 了解CDA考試詳情�;


 京公網安備 11010802034615號
經營許可證編號:京B2-20210330
京公網安備 11010802034615號
經營許可證編號:京B2-20210330
