數據聚類的簡單應用
數據聚類data clustering:用來尋找緊密相關的事物��,并將其可視化的方法�����。
1. 聚類時常被用于數據量很大(data-intensive)的應用中�。
2. 聚類是無監督學習(unsupervised learning)的一個例子����。無監督學習算法并不利用帶有正確答案的樣本數據進行“訓練”�,它們的目的是要在一組數據中找尋某種結構�,而這些數據本身并不是我們要找的答案����。
3. 聚類的結果不會告訴零售商每位顧客可能會買什么��,也不會預測新來的顧客適合哪種時尚��,聚類算法的目標是采集數據����,然后從中找出不同的數組����。
例如:可以通過聚類來對博客用戶進行分類
這個說法的假設前提是:我們有眾多的博客用戶���,但這些用戶并沒有顯著的特征標簽���,在這種情況下�,如何有效的對這些用戶進行分類��。這時候聚類就派上用場了���。
基本過程:
1. 構建一個博客訂閱源列表
2. 利用訂閱源列表建立一個單詞列表�����,將其實際用于針對每個博客的單詞計數�����。
3. 我們利用上述單詞列表和博客列表來建立一個文本文件�,其中包含一個大的矩陣�����,記錄者針對每個博客的所有單詞的統計情況����。(例如:可以用列對應單詞����,用行對應博客)����,一個可用的代碼如下:
[python] view plain copy
import feedparser
import re
# Returns title and dictionary of word counts for an RSS feed
def getwordcounts(url):
# Parse the feed
d=feedparser.parse(url)
wc={}
# Loop over all the entries
for e in d.entries:
if 'summary' in e: summary=e.summary
else: summary=e.description
# Extract a list of words
words=getwords(e.title+' '+summary)
for word in words:
wc.setdefault(word,0)
wc[word]+=1
return d.feed.title,wc
def getwords(html):
# Remove all the HTML tags
txt=re.compile(r'<[^>]+>').sub('',html)
# Split words by all non-alpha characters
words=re.compile(r'[^A-Z^a-z]+').split(txt)
# Convert to lowercase
return [word.lower() for word in words if word!='']
4. 當然這里有很多可以減少需要統計的單詞量的技巧�,有些常用的習慣性用于可以從這些列表中刪除掉��。具體的構建過程這里省略不談�����,感興趣的可以參考相關書籍���。
5. 進行聚類:這里有兩種可用的方法
分級聚類:
分級聚類通過連續不斷地將最為相似的群組兩兩合并�,直到只剩一個群組為止�,來構造出一個群組的層級結構����。其過程可以參考下圖:
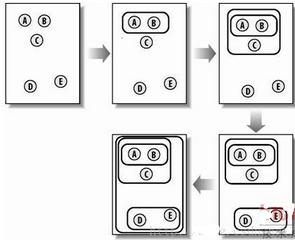
圖:分級聚類的過程
分級聚類基本算法如下:(這里省略了一些細節函數����,如加載文件�����,計算皮爾遜相似度等)
[python] view plain copy
def hcluster(rows,distance=pearson):
distances={}
currentclustid=-1
# Clusters are initially just the rows
clust=[bicluster(rows[i],id=i) for i in range(len(rows))]
while len(clust)>1:
lowestpair=(0,1)
closest=distance(clust[0].vec,clust[1].vec)
# loop through every pair looking for the smallest distance
for i in range(len(clust)):
for j in range(i+1,len(clust)):
# distances is the cache of distance calculations
if (clust[i].id,clust[j].id) not in distances:
distances[(clust[i].id,clust[j].id)]=distance(clust[i].vec,clust[j].vec)
d=distances[(clust[i].id,clust[j].id)]
if d<closest:
closest=d
lowestpair=(i,j)
# calculate the average of the two clusters
mergevec=[
(clust[lowestpair[0]].vec[i]+clust[lowestpair[1]].vec[i])/2.0
for i in range(len(clust[0].vec))]
# create the new cluster
newcluster=bicluster(mergevec,left=clust[lowestpair[0]],
right=clust[lowestpair[1]],
distance=closest,id=currentclustid)
# cluster ids that weren't in the original set are negative
currentclustid-=1
del clust[lowestpair[1]]
del clust[lowestpair[0]]
clust.append(newcluster)
return clust[0]
待分級聚類完成后�,我們可以采用一種圖形化的方式來展現所得的結果���,這種圖被稱為樹狀圖(dendrogram)���,如下圖所示���。例如:我們針對博客數據進行聚類�,以構造博客的層級結構�����,如果構造成功����,我們將實現按主題對博客進行分組�����。
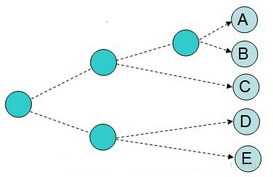
樹狀圖的繪制����,可以使用一個Python包:Python Imaging Library(PIL)
借助PIL���,我們可以非常輕松地生成帶有文本和線條的圖形�����。
[python] view plain copy
from PIL import Image,ImageDraw<span style="font-family:Arial, Helvetica, sans-serif;background-color:rgb(255,255,255);"> </span>
首先����,必須利用一個函數來返回給定聚類的總體高度���。
此外�,還必須知道節點的總體誤差����。蕭條的長度會根據每個節點的誤差進行相應的調整���,所以我們需要根據總的誤差值生成一個縮放因子scaling factor.
對于繪制的圖形���,線條越長就越表明�,合并在一起的兩個聚類差別很大�,線條越短��,則表示兩個聚類的相似度很高�����。
K-均值聚類:
分級聚類的結果為我們返回了一棵形象直觀的樹���。但存在兩個缺點:
1. 沒有額外投入的情況下����,樹形視圖是不會真正將數據拆分成不同組的
2. 算法的計算量非常大���,大數據集情況下�,速度很慢
K-均值聚類:
預先告訴速算法希望生成的聚類數量��,然后算法會根據數據的結構狀況來確定聚類的大小�。
算法首先會隨機確定K個中心位置��,然后將各個數據項分配給最臨近的中心點���。待分配完成之后��,聚類中心就會移到分配給該聚類的所有節點的平均位置處��,然后整個分配過程重新開始��。這一過程會一直重復下去���,知道分配過程不再產生變化為止���。
代碼如下:
[python] view plain copy
import random
def kcluster(rows,distance=pearson,k=4):
# Determine the minimum and maximum values for each point
ranges=[(min([row[i] for row in rows]),max([row[i] for row in rows]))
for i in range(len(rows[0]))]
# Create k randomly placed centroids
clusters=[[random.random()*(ranges[i][1]-ranges[i][0])+ranges[i][0]
for i in range(len(rows[0]))] for j in range(k)]
lastmatches=None
for t in range(100):
print 'Iteration %d' % t
bestmatches=[[] for i in range(k)]
# Find which centroid is the closest for each row
for j in range(len(rows)):
row=rows[j]
bestmatch=0
for i in range(k):
d=distance(clusters[i],row)
if d<distance(clusters[bestmatch],row): bestmatch=i
bestmatches[bestmatch].append(j)
# If the results are the same as last time, this is complete
if bestmatches==lastmatches: break
lastmatches=bestmatches
# Move the centroids to the average of their members
for i in range(k):
avgs=[0.0]*len(rows[0])
if len(bestmatches[i])>0:
for rowid in bestmatches[i]:
for m in range(len(rows[rowid])):
avgs[m]+=rows[rowid][m]
for j in range(len(avgs)):
avgs[j]/=len(bestmatches[i])
clusters[i]=avgs
return bestmatches
其過程如下圖所示:
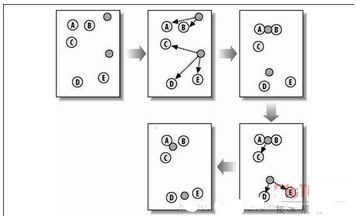
圖:K-均值聚類
CDA數據分析師考試相關入口一覽(建議收藏):
? 想報名CDA認證考試���,點擊>>>
“CDA報名”
了解CDA考試詳情���;
? 想學習CDA考試教材��,點擊>>> “CDA教材” 了解CDA考試詳情����;
? 想加入CDA考試題庫��,點擊>>> “CDA題庫” 了解CDA考試詳情���;
? 想了解CDA考試含金量����,點擊>>> “CDA含金量” 了解CDA考試詳情����;


 京公網安備 11010802034615號
經營許可證編號:京B2-20210330
京公網安備 11010802034615號
經營許可證編號:京B2-20210330
